Test results
Demonstrate your training successes to your management directly in the backend of our learning platform and analyze the data live according to the desired criteria.

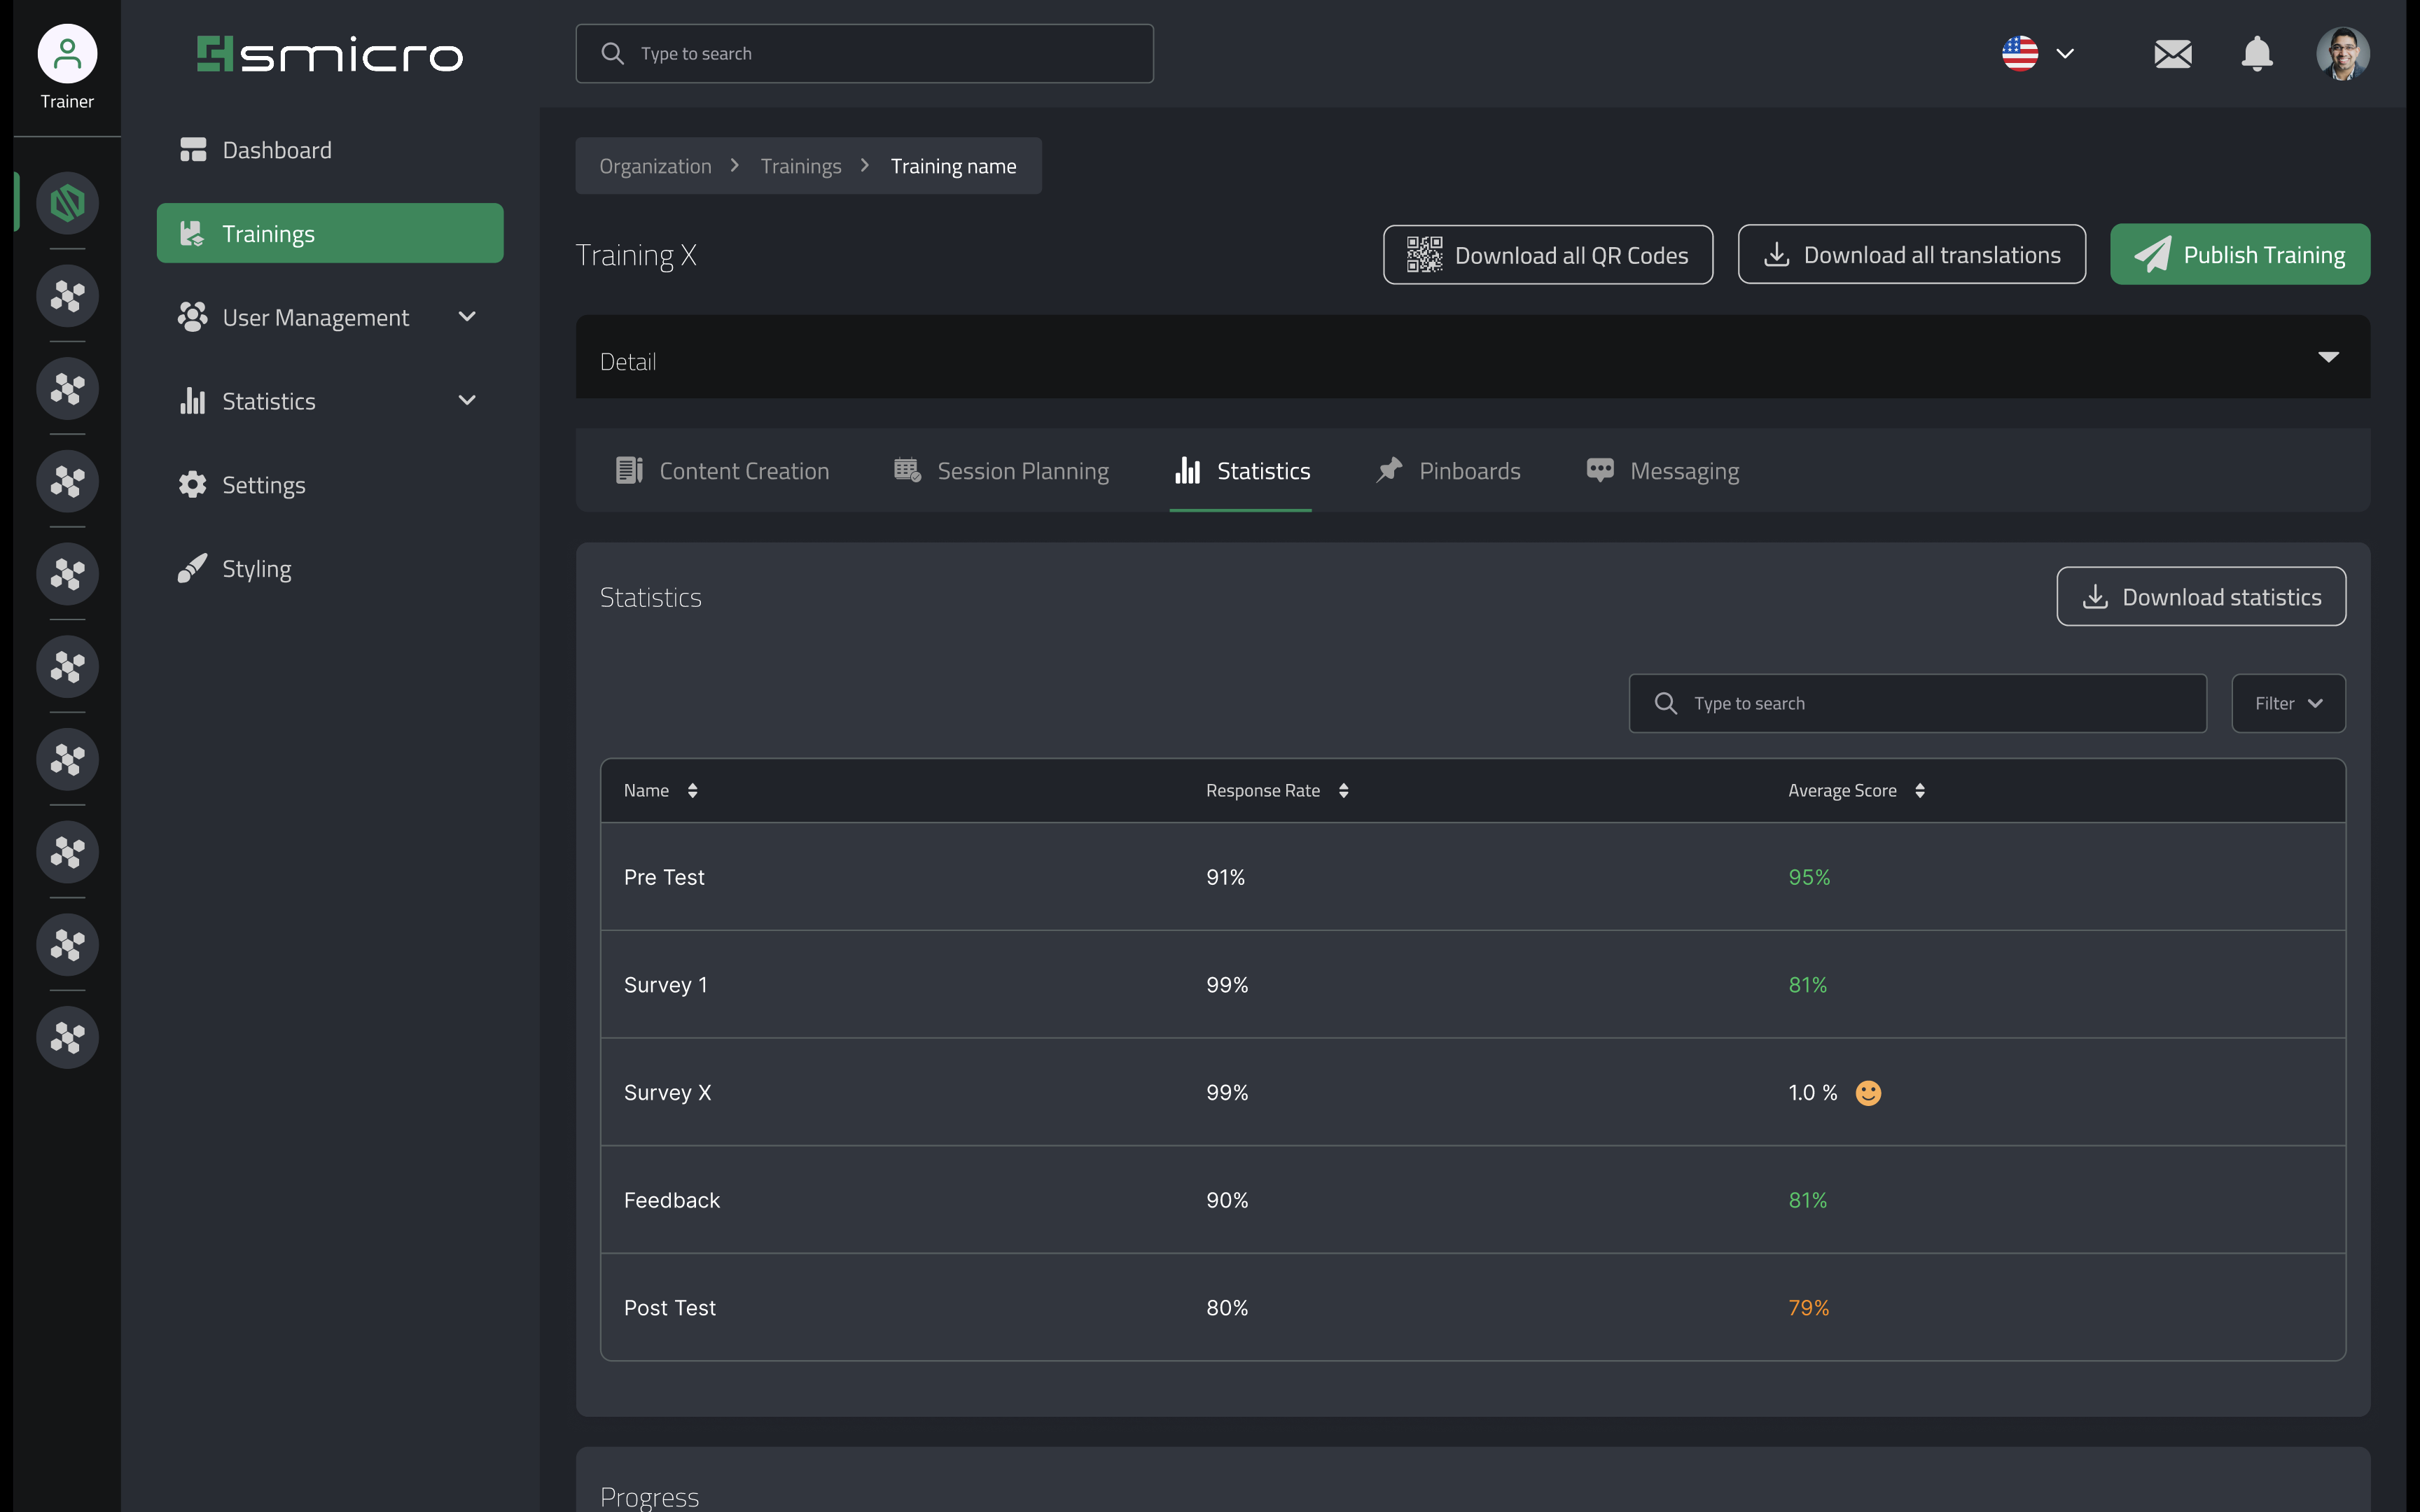
Figures are crucial because they help you make decisions and point the way forward. How successful was a training course? What is the level of knowledge of the participants? How is the current training course going? Our KPI dashboard offers your management an easy way to find answers to these and many other questions. In addition to individual participants, you can also track the cumulative learning progress of defined organizational units. All data can be exported with a single click for transfer to other systems or for targeted evaluation and presentation.
Test results
Rankings
Not only interesting for the participants! The rankings show which participants and which locations/departments are performing particularly well and where more capacity may be needed to bring everyone up to the same level. Decisions that significantly increase the efficiency of those responsible for training and therefore save costs.
Learning growth
Using targeted pre- and post-tests, you can document to your management, at any time, what learning gains you have created in your organization with your training. Or to put it another way: You demonstrate why the money you were given for your training was well invested.